

Over two years of working on a global clienteling mobile app, one of the biggest issues I kept running into was the dummy data in mockups. Clienteling involves a lot of client data, and all of it has to be reflected in the app. At the same time, the app was used in 13 markets across Europe and APAC, and each market has its own conventions for legal names, phone number formats, currency and so on.
I believe mockups and prototypes only feel real when the data is contextual and realistic to end users and business stakeholders. Feeling real brings whoever is giving feedback back to reality, and prompts them to give useful feedback.
Key problem: filling mockups with dummy data by hand took too long on a multi-market product
Why it took so long
Every value was curated in Figma by hand. Figma's Payload feature could cover part of this today, but it hadn't been released when I tried to solve this issue.
Alternatives I tried
 Sheets 2 Figma fills Figma layers from a Google Sheet.
I tried the Sheets 2 Figma plugin. It worked, but it still required me to curate a dataset in Google Sheets in advance. Using Claude Code or Codex to edit the Figma mockups through the Figma MCP server also worked, but the cost just didn't justify the approach.
So I decided to build a Figma plugin customised to my project context to solve this problem: localised, shareable with the team and easy to maintain.
Breaking the key problem into two smaller problems
The ideal flow I imagined: once the plugin reads the layer structure, it fills in coherent data automatically. Before developing a solution, I broke the key problem down into smaller ones.
1. How to create coherent values for a screen
For example, a client with an active status whose last purchase date a designer forgot to update to within the last 6 months. Or an order whose total is much smaller than the sum of all the SKUs listed in it.
2. How to keep data formats consistent for each market
With manual entry, mockups sometimes show JPY in the France market view, or +852 in the Singapore market view. The market context must be correct for everyone.
Solution: the Contextual Dummy Data private plugin
With help from Claude Code, I created a Figma plugin that reads the selected frames, identifies the right text layers and fills them with coherent, localised dummy data.
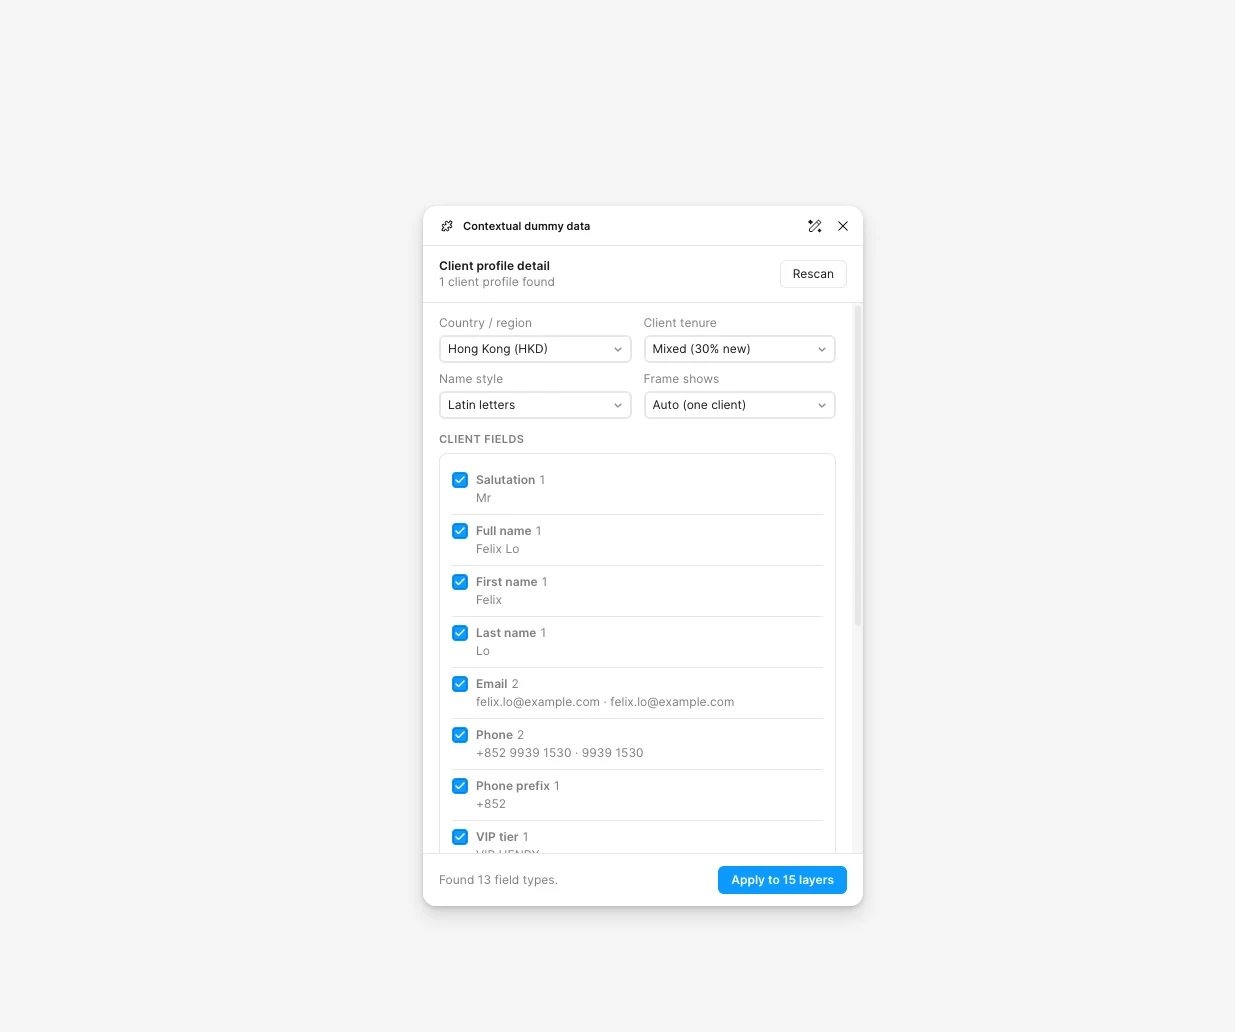 The plugin panel: pick the market, review each field it found, then apply.
An optional rename banner lets you review confusing layer names
The plugin relies on precise layer naming, so this step is the preparation for high-quality dummy data.
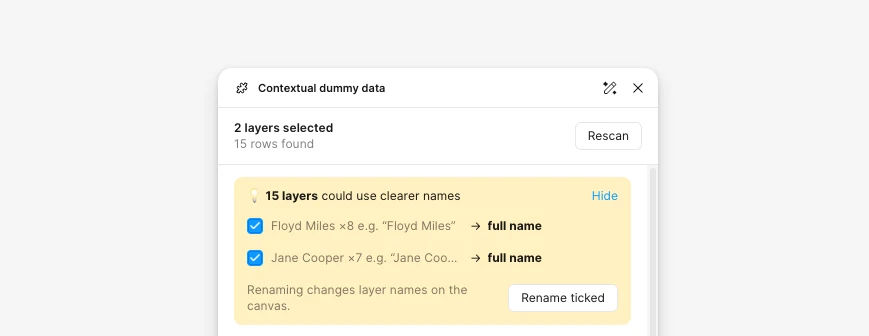 The rename banner suggests clearer layer names and renames the ticked ones on the canvas.
It detects the page type and fills data to match (solves problem 1)
For order data, the plugin makes sure the calculation is correct (grand total = all items − discount + shipping + tax), with the market's tax rate taken into account.
After applying, the result page lists every change, from the old value to the new one. If you want to inspect a change, Select picks that updated layer on the canvas.
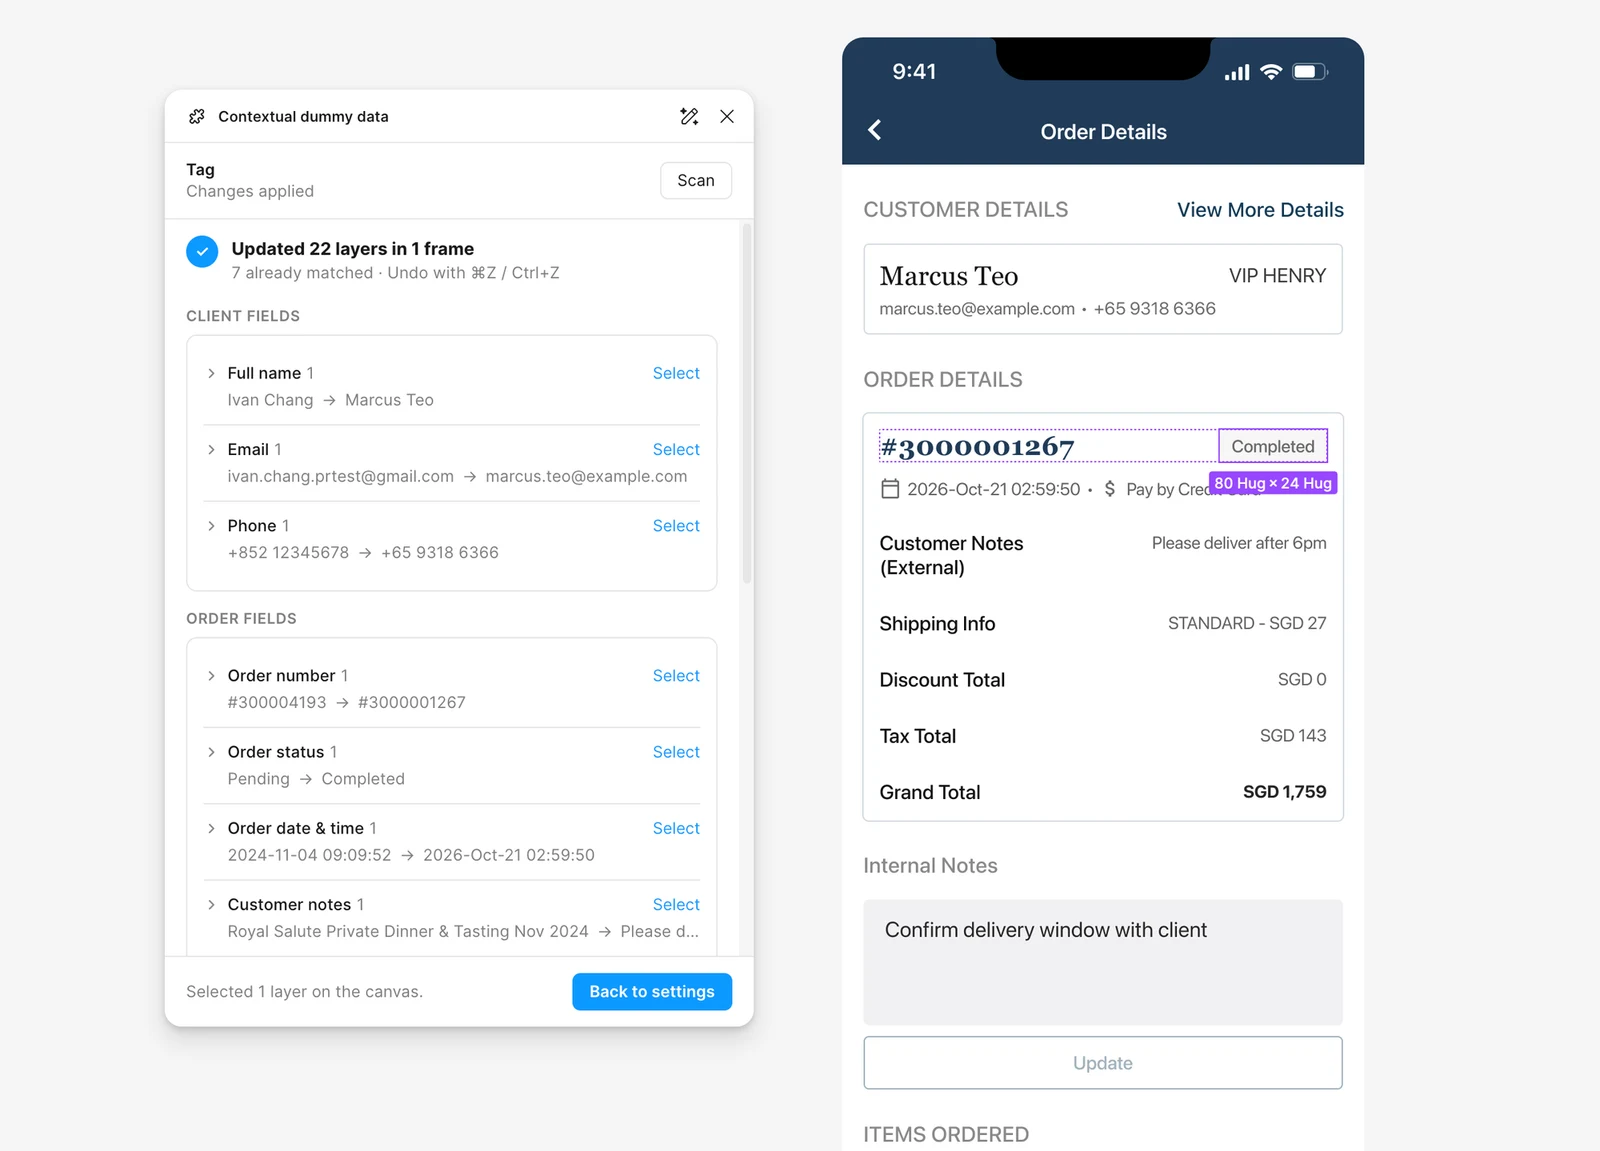 The result page: Select picks the updated layer on the canvas, here the order status tag.
For client data, the plugin keeps the whole page coherent (for example, a client from Hong Kong shows the +852 prefix with an 8-digit phone number). The data also follows business logic, such as the last purchase date being within the past 6 months for an active client.
A currency and region switch keeps content localised (solves problem 2)
The switch sets the phone number format, phone prefix, currency and tax rate. The name style adds another setting to decide whether client names should be in the local language, especially for Taiwan and Japan.
Bonus: every change is design system compliant
The plugin is component-aware. When an order status changes, the tag component switches to the matching instance too, so no instance gets detached. Colour and text tokens are all preserved.
Impact
Time per screen is my own estimate, not a formal measurement.
- Time per screen: about 2 minutes (120 s) by hand, about 10 s with the plugin.
- 15 screens: about 30 minutes by hand, about 2.5 minutes with the plugin.
Time saved per screen: (120 s − 10 s) / 120 s ≈ 92%. Over 15 screens, that's about 27.5 minutes every time the mockups are refreshed or switched to another market.
There were other gains that are harder to measure:
- Consistency: order totals add up, statuses match dates, and lists are sorted every time.
- Market switching: a whole flow can be re-run for another market in seconds, instead of re-curating every screen.
- Better reviews: stakeholders react to the design, not to data that doesn't make sense.
- Detail screens are covered too: profile screens no longer need a manual pass to make the header and the details table agree.